

There is a multitude of methods for measuring willingness to pay. However, there is a lack of comparative studies and therefore of evidence-based advice on which methods are useful in which context.
The emergence of the new method group “Implicit Pricing Intelligence“ was reason enough to put the method spectrum through its paces.
The following were used as comparison criteria
A number of companies were recruited for the study, providing market share data, average market prices, unit costs and dealer margins. Due to the confidentiality of this information, the product tested cannot be disclosed.
1. The “optimal price” according to Van Westendorp is independent of the optimal price, which is obtained by taking into account the costs.
According to Van Westendorp, the optimal price point is at the price where the number of people who find the price “too cheap” and those who find it “too expensive” are equally low.
Evidence for this rule is not found in the literature. There is a reason for this: a price is usually considered optimal when profits are maximized. But a calculation of a profit-optimal price usually cannot be factually possible if costs and dealer margins are not included in the calculation at all.
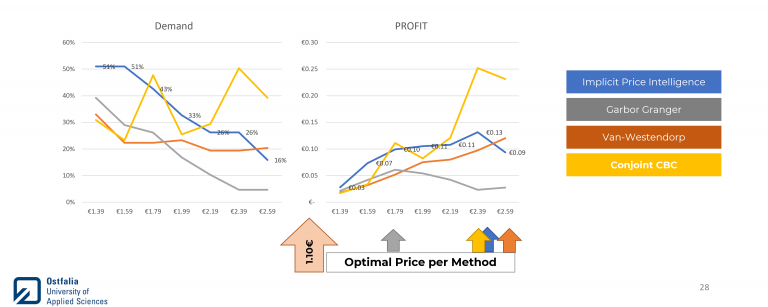
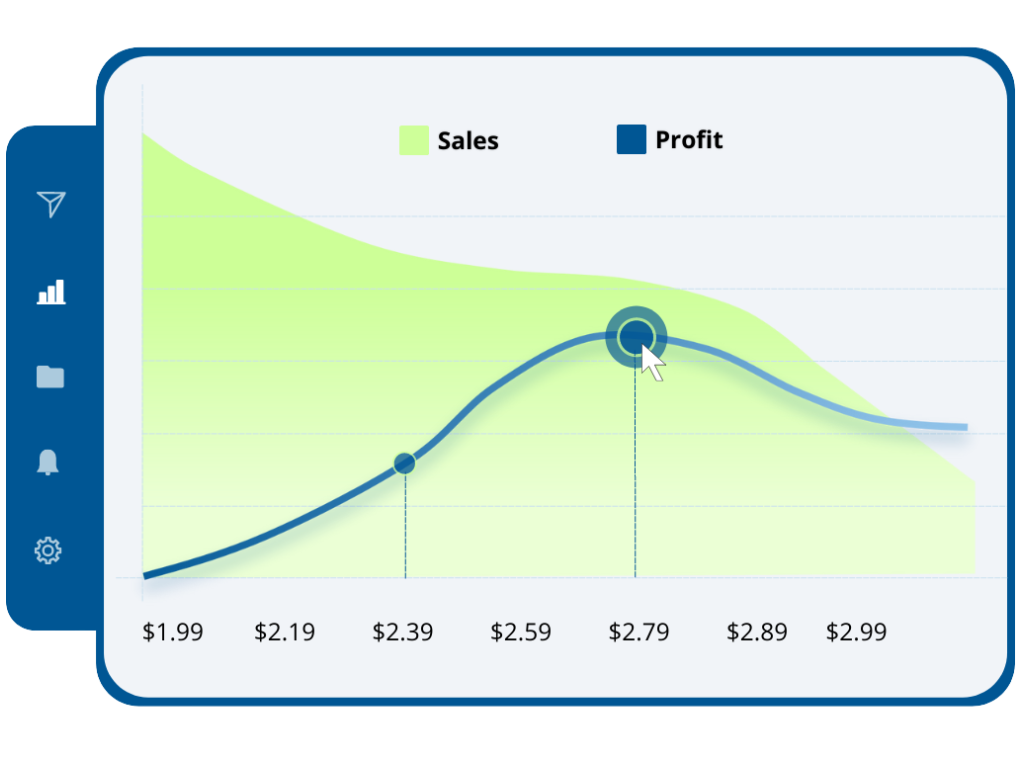
This is exactly what this study shows. We interpret all customers who consider a price to be neither “cheap” nor “expensive” as so-called “definite buyers” and can thus draw the price-demand curve.
If we multiply the demand by the price, we get the sales. If we subtract the VAT, the retail margin and unit costs, we get the profit.
Across all 13 products we see that the “optimal price” according to Van-Westendorp deviates sometimes seriously from the cost-induced optimal price.
Here is a result chart for a pet food product. The “optimal price” is 1.10€ and the cost induced optimal price according to Van Westendorp is $2.99.
The bestselling book „Pricing Intelligence“ has more on the topic and
2. Conjoint (CBC) does not seem to be reliable when only brand and price are considered as characteristics.
Conjoint measurement was used as choice based conjoint. Here the study worked with only two attributes – the brand and the price. This approach was justified as follows:
Justified by market demand: especially simple consumer goods and goods of daily use are not easily or always meaningfully divisible into a bundle of features. A chocolate bar could theoretically be “featurized” into caramel, peanut, chocolate coating, or other contents. However, this does not necessarily correspond to the way consumers think and make decisions. The “Featurisierung” can represent therefore a distortion of the purchase decision situation.
Justified by literature: according to Byron Ohrme, CTO of Sawtooth, it is fine to conduct brand + price only CBC’s: “if brand + price only CBC’s were systematically failing because respondents knew it was just about brand vs. price tradeoffs, there would be a lot of grumbling and abandonment of this approach – which is not seen.”
Across all 13 products tested, however, the conjoint results are not plausible. They zig-zag along the price range.
Here is a result diagram for a refrigerator.
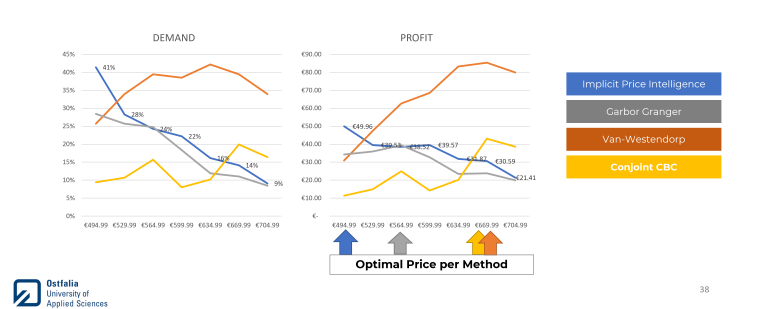
These results do not refute the value of conjoint analysis per se. There are a number of studies that demonstrate the impact of the method. However, such studies were primarily aimed at optimizing the product -not just the price. In the context of product optimization, the method has proven its value.
However, if we consider the application where the optimal price has to be found for a simple product, our study casts doubt on whether conjoint is a viable solution.
This finding is particularly relevant because conducting conjoint analysis requires more effort, training and knowledge than other methods, and consequently requires higher investment.
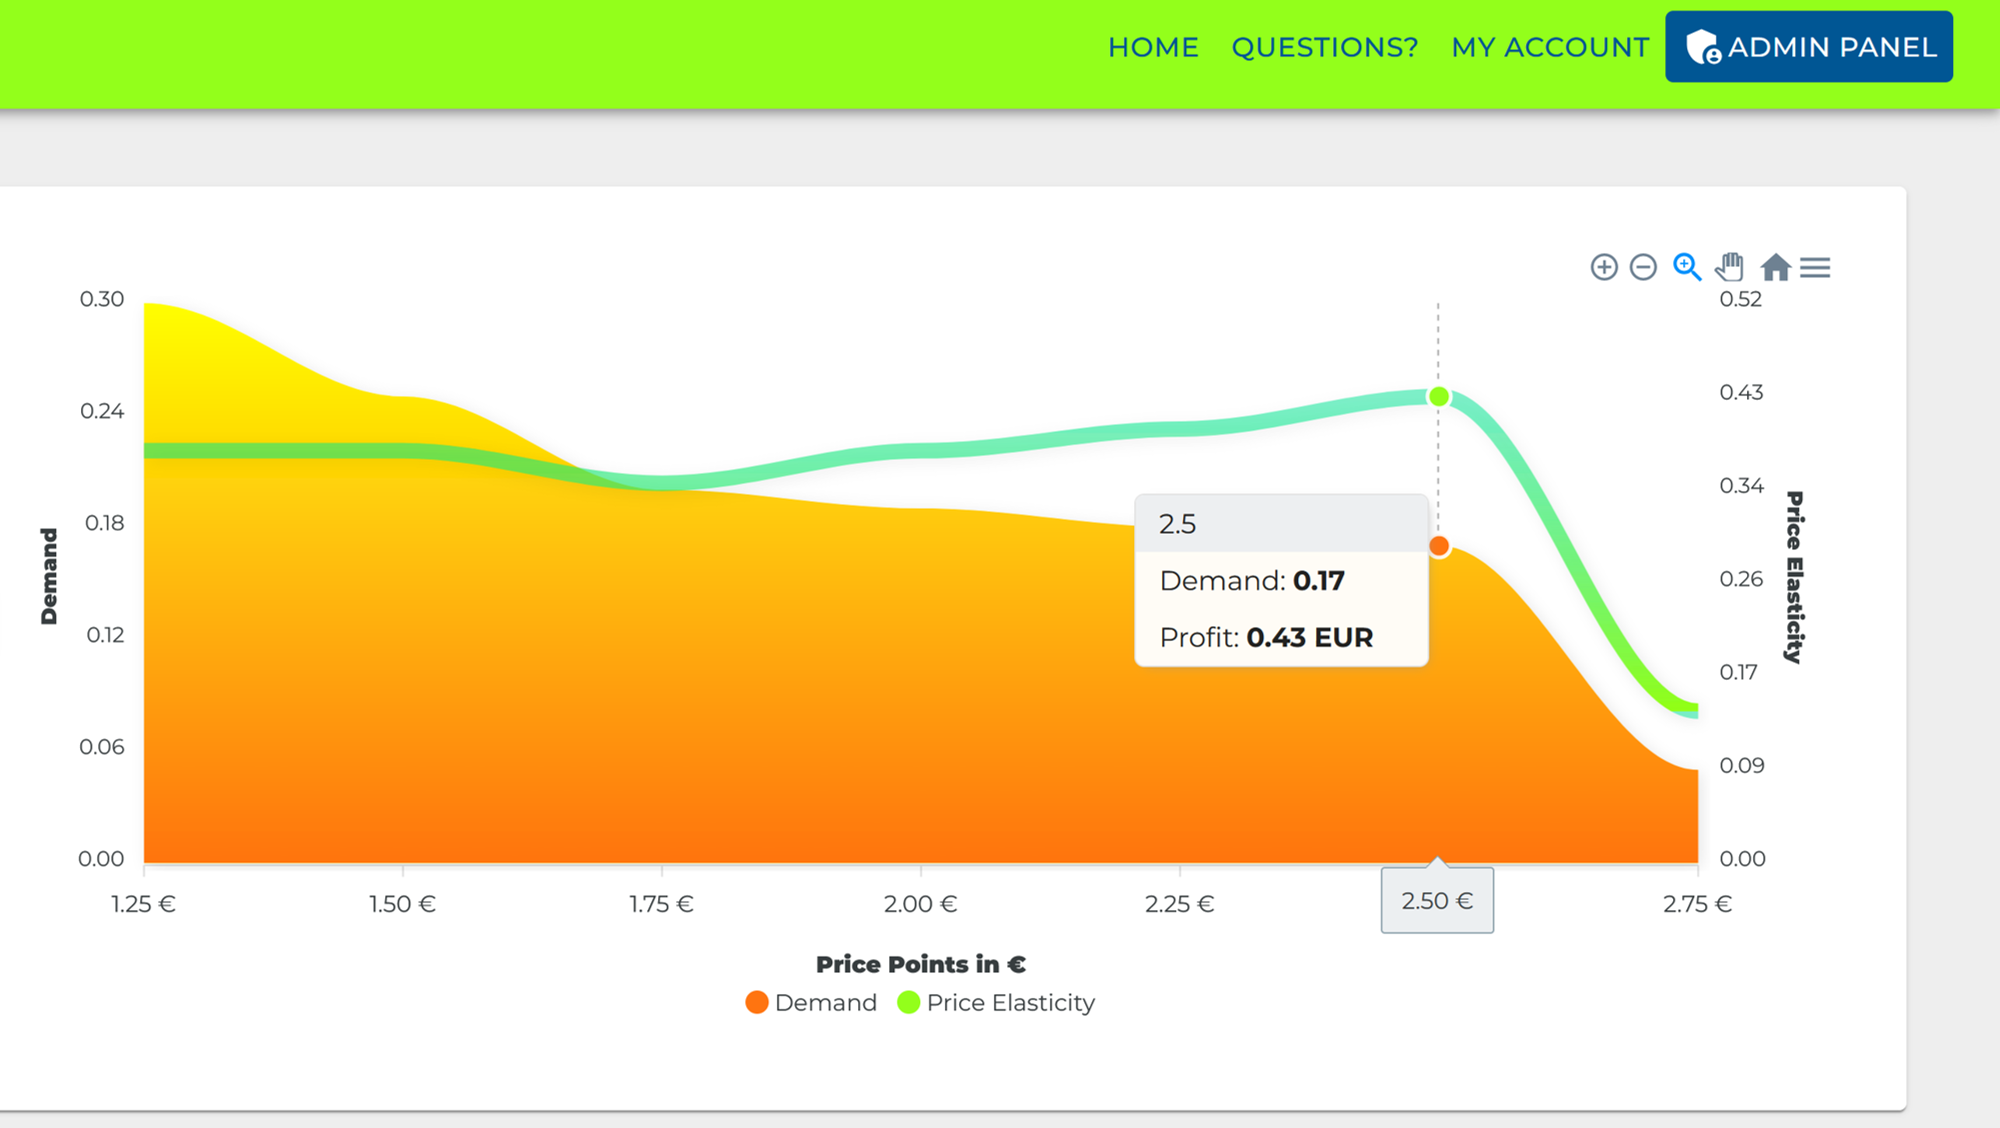
3. Gabor-Granger underestimates demand and price elasticity.
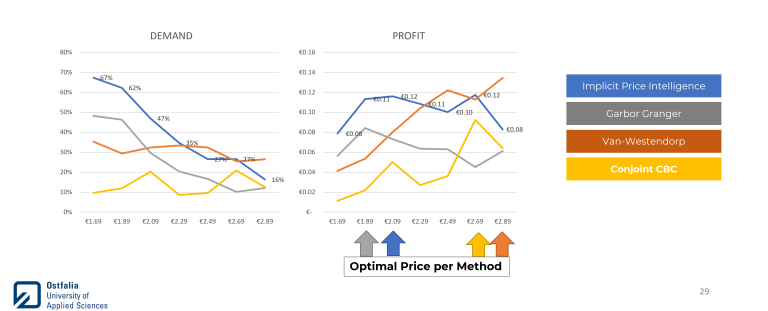
The Gabor-Granger (GG) price-sales function has the most similarity to that of the IPI. This is not surprising, since GG is the explicit interrogation of propensity to buy per price, whereas IPI accomplishes this implicitly.
Throughout, it can be observed that the “Definite buyers” according to Garbor Granger (Top1 of the 5 scale) are in most cases significantly below the price-sales function of the IPI. This phenomenon was to be expected from a psychological point of view. Explicitly, consumers tend to be reluctant to “admit” their willingness to buy.
Here is an example of an animal snack product
Some professionals prefer to access video tutorials around pricing and insights
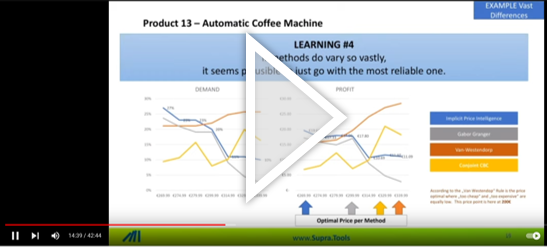
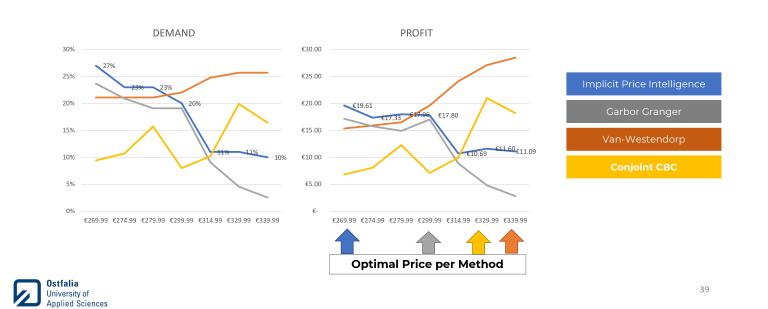
4. Optimal prices differ significantly depending on the method.
The overall view of all tested products can be surprising in one aspect. All four methods are considered valid methods of price optimization and are used daily in the market. However, in some cases they deliver fundamentally different optimal prices than the recommendation.
Even the comparison between GG and IPI is surprising. The price-sales functions are visually similar. But taking into account VAT, retail margin and unit costs, the optimal prices are completely different.
This observation is of great importance – after all, we know that a small change in price can have a big impact on profit.
Conversely, this means that companies cannot or should not afford to compromise on the quality of willingness-to-pay measurement.
Here are the results of a coffee vending machine as an example:
The four core observations of the Face Validity Check yield an inconsistent statement by the Price Sensitivity Meters (Van Westendorp), an expected underestimation of demand by Garbor Granger and implausible results by Conjoint in the applied variant. Implicit Price Intelligence (IPI) has the most plausible results from a face validity perspective. The participating companies confirm this from their expert point of view.
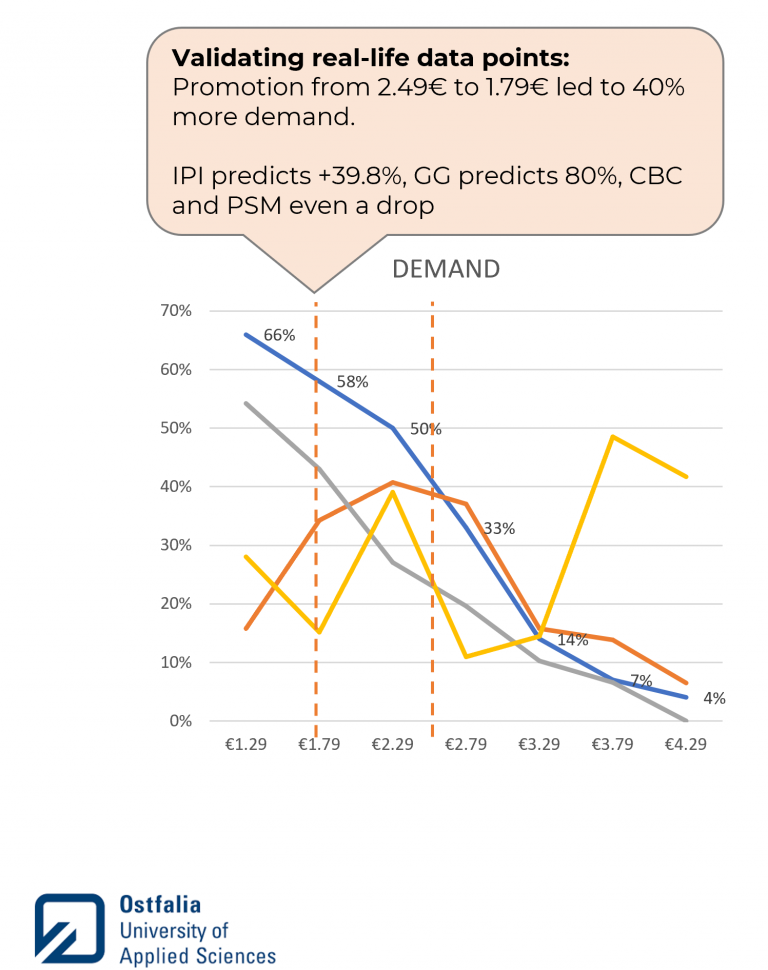
For empirical validation of the results, the demand forecasts of the methods were compared with the actual market shares. For this purpose, the mean market price and market share were compiled prior to the study.
It is to be expected that a higher demand forecast tends to be associated with higher market share.
Of course, this correlation is skewed by several other factors, as market share depends on several factors outside of the attractiveness of the price and the product. The main factors influencing market share are 1. the narrowness/breadth of the definition of the market itself, 2. advertising intensity, 3. competitive breadth and strength.
However, all four measurement methods are subject to the same biases, so we only need to interpret the resulting correlation in relative terms. To accomplish this, we have adjusted the correlation.
The results show a clear picture: Implicit Pricing Intelligence (IPI) has the size validity, followed by Garbor-Granger (GG).
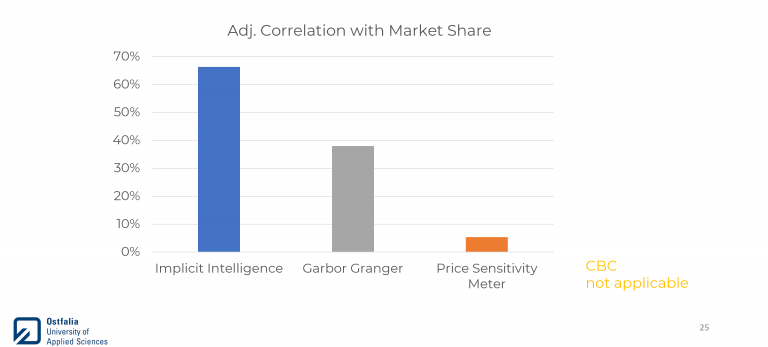
Despite the small sample of n=13, the statistical confidence is 81% that the IPI is more valid than GG and 96% that it is more valid than PSM.
Today pioneers use the latest pricing survey tools that use Neuroscience + AI
Interested professionals can use some tools even for free and explore on its own
You can access supra tools free here.
The results paint a clear picture. When it comes to pricing classic consumer goods, Implicit Pricing Intelligence seems to deliver the highest validity. However, each of the tested methods has its raison d’être, as each has its own advantages and fields of application.
CONJOINT (CBC) has proven valuable for optimizing products and their attributes. However, the results in a brand-price product profile context seem to have little validity.
Van Westendorp (PSM) is valuable for exploring and discovering an unbiased price range for new products because the method does not require a predetermined price range. Neither the derived “definite buyers” nor the “optimal price” appear to have any predictive goodness.
Garbor Granger (GG) is suitable for a quick assessment of possible price ranges. It is easy to set up and interpret and can be incorporated into surveys by anyone and is a proven tool as a preliminary analysis.
Implicit Pricing Intelligence (IPI) provides the best demand predictions and thus optimal price recommendations. At the same time, this study shows how sensitively the optimal price point depends on the correct measurement of the price-sales function.
Therefore, a compromise on the quality of the forecast would be a costly undertaking. This becomes clear when considering the leverage of price. With a 10% profit margin, a 5% price increase -which has no sales effect- leads to a 50% higher profit. An inaccurate sales effect measurement therefore has enormous consequences.
Do you have questions or suggestions? Please feel free to contact the persons involved in the study:
Scientific direction:
Prof. Dr. Axel Lippold
a.lippold[at]ostfalia.de
In my email newsletter “Pricing Insights” I cover the whole range of pricing insights solutions-from Garbor Granger to Conjoint, from NeuroPricing to Pricing Software Systems. I describe the application in various fields from new product pricing to promotion, from brand premium to feature pricing.
Keep up to date here.