

Many aspects are involved if you look at textbooks and reference books on pricing. It is about determining the optimal price for certain constellations from the price-sales function. It is about how the situation changes when there is a sales intermediary – the trade. It is about the specifics of new products, price bundling, and assortment pricing. It is about organizational promotional tactics. It is about the psychological effects of anchor prices, sequence effects, the influence of graphic design, it is about threshold prices, and and and.
All these specialized books presuppose that it is known how customers react to prices and the change of these up to the purchase resistance with a product or a service quite fundamentally. The object of desire is formally called the price-demand function or price elasticity.
It is all the more astonishing that three facts have to be stated:
Only selected new products are analyzed today. Large players afford sales modeling where price-demand functions for certain products in certain markets can be calculated for a narrow price spectrum based on real shelf prices and sales volume data. However, these are limited to narrow price ranges and existing products.
In short, there is a clear need to understand customer price willingness and exactly what their price sensitivity/price sensitivity is, and how at what price points.
The bestselling book „Pricing Intelligence“ has more on the topic and
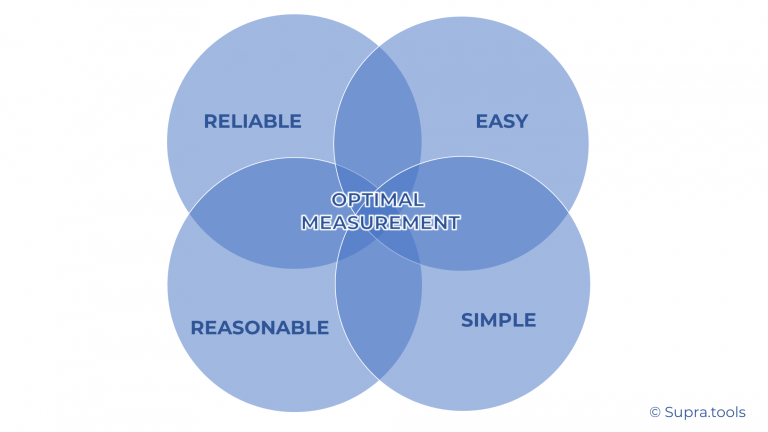
If one is striving for broader use of willingness to pay measurement, four objectives are key:
– Easy to set up: Ideally, companies should be able to set up the measurements independently without resorting to a special market research industry. Even medium-sized companies often have hundreds of SKUs, hundreds of new SKUs every year and therefore need a solution for all products.
– Cost-effective: In line with the number of SKUs, the price per measurement should not represent an insurmountable investment, as the investment required can scale quickly over hundreds of SKUs.
– Easy to interpret: Insights can be implemented most effectively in the enterprise if they are easy to access and understand.
– Reliable, accurate enough: The simplest, cheapest, and most intuitive solution is not worth implementing if it does not deliver valid results. Biased information can even harm. However, if the information is indicatively correct, an inaccurate estimate may be better than not performing one and relying entirely on expert opinion.
When RedBull invented the energy drink, the price issue had to be resolved as with any new product. It was clear to the creators: the willingness to pay is largely driven by how well the holistic added value and benefits are communicated. Drinks with bold “stimulant promises” already existed at that time.
After this groundwork was exemplified, the brand conducted a Van Westendorp NSS Price Sensitivity Meter (PSM) analysis. This process is designed to explore the space of possible price points.
It revealed a willingness to add a price of 20% to a maximum of 50%. However, the brand later opted for a much higher price premium. Why?
Van Westendorp determines the price space where most potential customers consider price points fundamentally acceptable. However, this price space changes fundamentally when looking at a narrower target group.
This is exactly what RedBull did and found a price potential of almost 300%.
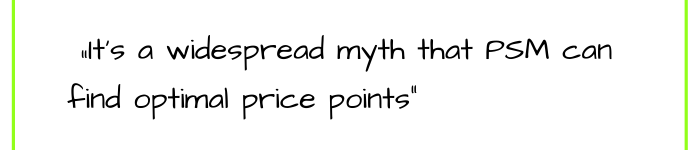
However, valid price optimization is not possible with the van-Westendorp Price Sensitivity Meter. “Why?” more on that in a moment.
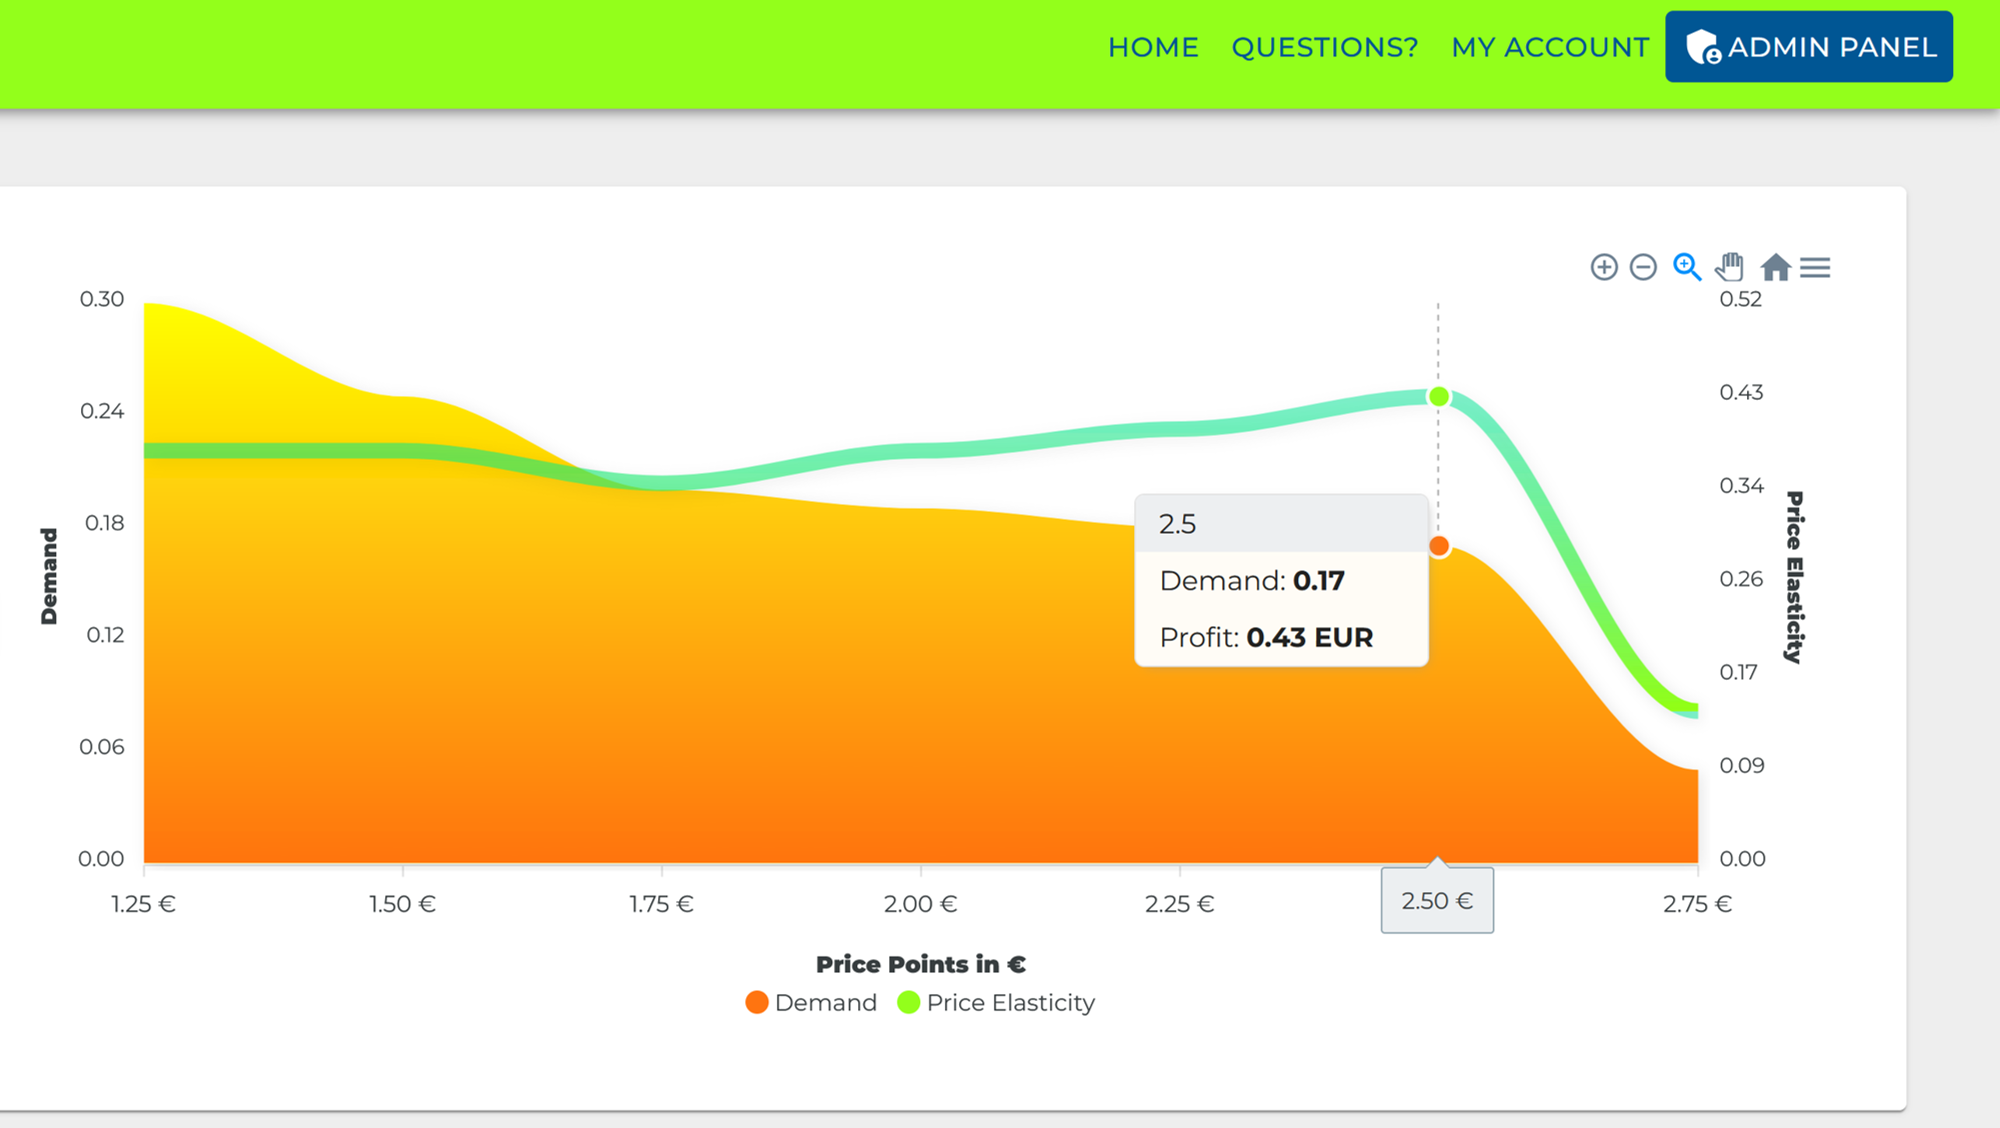
Therefore, Gabor-Granger was used next. It enables an estimate of the demand created given a price.
The optimization results were then validated and calibrated in test markets. The rest is history.
Here’s how it works methodically:
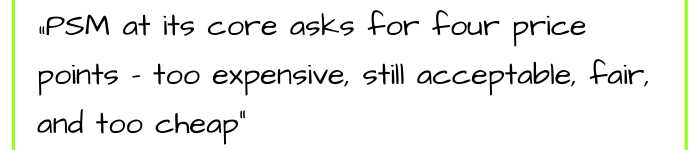
The Van Westendorp Pricing Model originates from market research, was developed in 1976 by Peter Van Westendorp, and is based on these four unaided questions:
The success of the evaluation of the Van Westendorp Pricing Model is calculated as a percentage across four metrics for each price point and rated by respondents as follows:
– Too Expensive: This or lower prices are perceived as too expensive.
– Too Cheap: This or lower prices are NOT perceived as too cheap.
– Expensive: This or lower prices are found to be expensive but still acceptable.
– Cheap: This or lower prices are perceived as NOT cheap.
The intersections of these metrics mark the price range and the (supposedly) optimum price point.
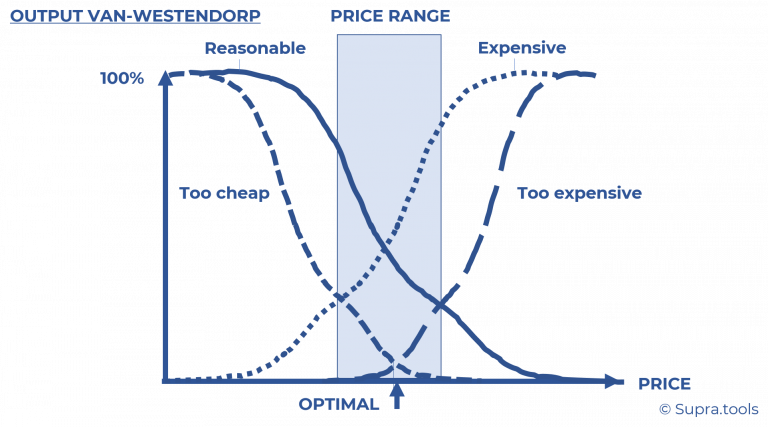
– Lower price limit of the price range: Expensive=Too Cheap. The price that more people consider “expensive/still acceptable” than people consider the product “too cheap.”
– Upper price limit of the price range: Cheap=Too Expensive. A price that more people consider “too expensive” than people consider the product “cheap.”
– Optimal price point: Too expensive=too, cheap. Price at which the number of people who do not consider purchasing because the product is too expensive or has too cheap prices is minimal.
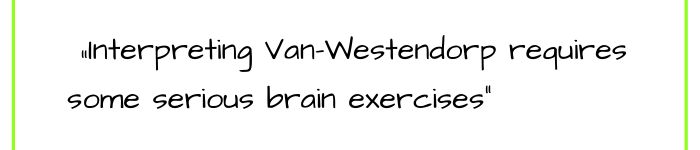
The methodology is suitable for exploring the acceptable price range of possible price indications without any influence. The evaluation logic has a plausible appearance but is a good example of how misleading plausibility can be.
It already starts with the fact that the price at the “too expensive = too cheap” point is by no means one of the prices where the sum of both numbers is minimal. This is often true, but it is rather coincidental.
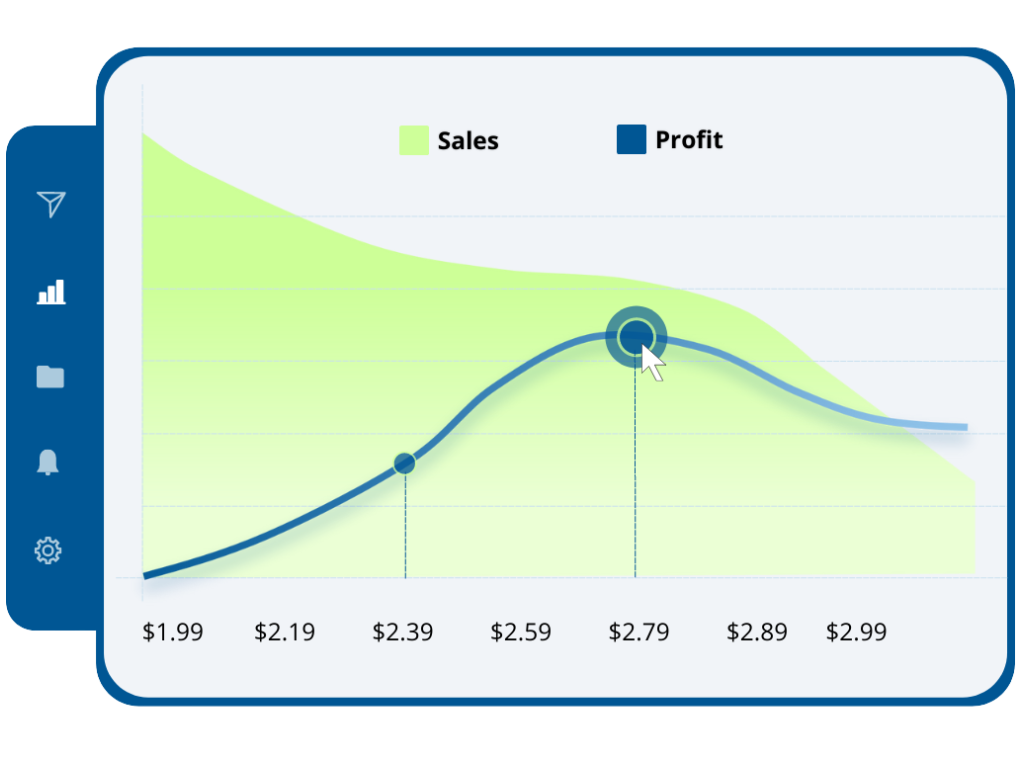
Furthermore, the evaluation logic is based on the idea of finding the prices with the highest demand. This idea is suitable for identifying a price corridor to search for the optimal price points.
However, it is not suitable for profit-optimal pricing. This is because optimal prices maximize profit, not sales. Profit depends on the margin that results from prices.
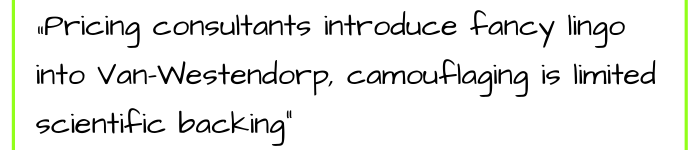
It is an open secret in user practice (which is interestingly not reflected in the language of the pricing literature) that the Van Westendorp method may be a way to identify price corridors. Still, it is unsuitable for getting a good handle on the issue of price optimization.
Some professionals prefer to access video tutorials around pricing and insights
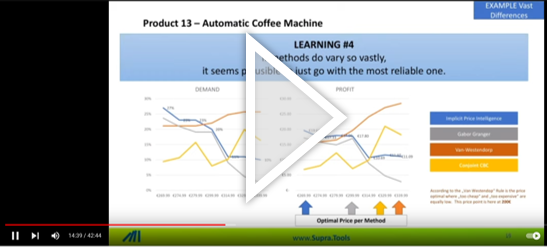
The van Westendorp method allows us to explore the framework and the price spectrum of possible prices in an unbiased way. Garbor-Granger is the simplest method to enable meaningful profit-maximizing price optimization.
Both methods are subject to strong survey biases in some cases. Depending on the context, respondents tend to underestimate their willingness to pay. The extent of the bias varies greatly in individual cases, so it cannot be anticipated across the board.
The quality of the survey also depends on the realism of the product description. Products whose willingness to pay is largely determined by the price of the comparison product (shelf neighbor) should be presented in the same way: a shelf example with an anchor price of the shelf neighbor. For this case, the two approaches measure a price-premium propensity score rather than the price-demand function.
To avoid the response bias regarding the underestimation of willingness to pay, so-called indirect methods have been developed
– NeuroPricingTM
The first two groups of methods do not meet the characteristics listed above. They are not easy to set up and easy to interpret, nor are they cost-effective.
Implicit IntelligenceTM is an exception. Here, measurement methods from Neuroscience are used and calibrated with Causal Machine Learning. While the methodology is elaborate, it is as simple as Garbor-Granger for the user, and the cost is also moderate.
The methodology has been tested and perfected by Supra.Tools experts since 2016. They are a valuable addition to the spectrum of methods for price optimization.
Learn more about Implicit IntelligenceTM in this article.
Today pioneers use the latest pricing survey tools that use Neuroscience + AI
Interested professionals can use some tools even for free and explore on its own
You can access supra tools free here.
What is Van Westendorp’s pricing analysis?
Van Westendorp pricing analysis is a research methodology used to measure how much a given price change will affect demand for a product or service. This pricing analysis uses four prices, each one lower than the previous, to determine the “break-even” point where demand begins to decline.
The analysis helps identify whether a product is overpriced, underpriced, or priced just right. It is named after Peter van Westendorp, who developed the technique in 1976.
What are the Van Westendorp price sensitivity survey questions?
Van Westendorp’s pricing strategy uses four survey questions to gauge price sensitivity and elasticity. Which are:
These Van Westendorp’s Price Sensitivity survey questions can help you determine how customers feel about the price and their spending power. By asking these four questions, you can better understand customers’ willingness to pay and their budget. This information can help you set profitable prices that customers are willing to pay.
How does excel calculate Van Westendorp?
Van Westendorp is a common pricing model that uses four different questions to gauge consumer willingness to pay for a product or service. The four questions ask consumers about their most and least acceptable prices and the price at which they would begin to consider the product too expensive.
Excel can be used to calculate Van Westendorp by inputting the data from the four questions into separate cells. The formulas for the calculation are as follows:
Most acceptable price = (Highest acceptable price + 2nd highest acceptable price)/2
Least acceptable price = (Lowest acceptable price + 2nd lowest acceptable price)/2
Implied value = (Most acceptable price + Least acceptable price)/2
Price tolerance = Most acceptable price – Least acceptable price
These formulas can then be used to create a graph of the data, which can visualize consumer willingness to pay.
What is the optimal price point in Van Westendorp?
The optimal price point in Van Westendorp is the price that maximizes consumer satisfaction while also generating the most profits for businesses. To find this sweet spot, businesses need to consider a number of factors, including consumer demand, production costs, and competitor prices.
Van Westendorp’s model suggests that there are four ‘zones’ of optimal pricing to which consumers react differently:
To find the optimal price point, businesses need to consider all of these factors and strike a balance between them. The final decision will depend on the specific product or service being offered and the market conditions. However, by taking all of these factors into account, businesses can ensure that they are maximizing both consumer satisfaction and their profits.
What are the benefits of the Van Westendorp Price Sensitivity method?
There are several benefits of using the Van Westendorp Price Sensitivity method, including:
How is Van Westendorp calculated?
Van Westendorp is calculated by first surveying people to find out how much they would be willing to pay for a product or service.
The Van Westendorp method works by asking customers to rate their perceptions of a product or service on a scale from “Too Cheap” to “Too Expensive.” Customers are then asked to identify the price at which they would begin to consider the product or service to be ” expensive,” ” cheap,” or ” just right.” It is usually performed to determine the likelihood that people will buy the product or service at different prices.
The Van Westendorp method is typically represented by a graph, with the x-axis representing price and the y-axis representing the percentage of customers who gave each response. The “optimal” price is usually considered to be the point at which the lines for “too cheap” and “too expensive” intersect. This information is then used to calculate the optimal price.
How do you use a Van Westendorp price sensitivity meter?
A Van Westendorp price sensitivity meter measures how much a customer is willing to pay for a product or service. It can help businesses set acceptable prices that align with what customers are willing to pay.
There are a few different ways businesses can use a price sensitivity meter. One way is to offer various products or services at different prices and see how customers react. This can help businesses find the right price point for their products or services.
Another way businesses can use a price sensitivity meter is to conduct customer surveys. This can help businesses to gauge how customers feel about different prices.
What is the indifference price point?
The indifference price point can be defined as the specific price at which a product is perceived as neither expensive nor cheap. This means that an equal number of people view the product as a good value and those who view it as too expensive. The indifference price point is also known as the perceived normal price.
Businesses can conduct customer surveys or use market research data to find the indifferent price point for a product. This information can then be used to price products in a way that is most likely to be perceived as fair by most potential customers.
What is the point of marginal cheapness?
It is the lowest possible price that can normally be charged to a customer during the product testing phase.
Marginal cheapness is a business pricing strategy employed to increase market share by selling products or services at or just below the cost of production. The goal of the marginal cheapness pricing strategy is to make it difficult for competitors to match the price and still make a profit, leading to increased market control and dominance.
What does it mean if consumers are price sensitive?
Price-sensitive consumers are those who make purchase decisions based on only price. For these people, the lower the price of a product, the more likely they are to buy it. In other words, they are always looking for a good deal. Such consumers can be very important to businesses, especially in industries with heavy competition.
Price-sensitive consumers are always looking for ways to save money, whether through coupons or discounts or simply being cautious about what they purchase. This can be a challenge for businesses, as they need to find ways to appeal to these types of customers without compromising their bottom line.
How do you ask a price question in a survey?
When conducting a survey, it is important to ask price questions to allow you to obtain the most accurate data possible. There are a few different ways to ask price questions, and which one you use will depend on the type of product or service being surveyed.
If you are surveying people about their willingness to pay for a product or service, you will want to use an open-ended question. This type of question will allow respondents to give their own price without influencing any preset options.
If you are surveying people about their actual spending on a product or service, you can use a close-ended question. This type of question will give respondents options to choose from, making it easier to collect data.
When asking price questions, it is important to be as specific as possible. This will help ensure that you obtain accurate data that can be used to make decisions about your product or service.
Here are some tips for asking a price question in a survey:
What is price sensitivity?
Price sensitivity is the degree to which a consumer’s demand for a good or service changes in response to changes in its price. In other words, it is a measure of how much price affects consumer demand. However, price-sensitive consumers are those whose demand increases when prices fall and vice versa.
Many factors can affect price sensitivity, including income level, the availability of substitutes, and the perceived necessity of the good or service in question.
How is price sensitivity measured?
There are a few different ways that market researchers measure price sensitivity. One common method is using a Van Westendorp Price Sensitivity Meter (PSM). This approach involves asking respondents to rate their willingness to purchase a product at different price points, from “very cheap” to “very expensive.”
Another common method for measuring price sensitivity is conjoint analysis. This approach involves presenting respondents with different product features and configurations and asking them to choose the option that they would be most likely to purchase. The pricing information gathered through conjoint analysis can then be used to generate a demand curve, which can be used to understand how price changes will impact demand.
How do you read a Van Westendorp diagram?
It’s quite simple – all you need is a Van Westendorp diagram and a bit of knowledge about interpreting it.
A Van Westendorp diagram is used to understand how people perceive prices for goods or services. The four corners of the Van Westendorp represent different price points, and the lines connecting them show how people respond to prices at each level.
Here’s a quick breakdown of the four corners of the Van Westendorp:
Now that you know the basics of the Van Westendorp let’s take a look at how to interpret it.
There are two main ways to interpret a Van Westendorp diagram: the crossing and middle-ground methods.
The crossing method is the more common of the two, and it simply involves finding the acceptable price range at which the lines cross. This price point is generally considered the optimum price for the good or service.
The middle-ground method is less common, but it can be useful in certain situations. This method involves finding the average of the four corners of the Van Westendorp. This price point is generally considered a good compromise between the different price points.
What factors affect price sensitivity?
Many factors affect an individual’s price sensitivity. These include income, wealth, perceived value, and past experiences.
In my email newsletter “Pricing Insights” I cover the whole range of pricing insights solutions-from Garbor Granger to Conjoint, from NeuroPricing to Pricing Software Systems. I describe the application in various fields from new product pricing to promotion, from brand premium to feature pricing.
Keep up to date here.